Profiling#
The LiteBIRD Simulation Framework implements a few tools to measure the performance of the code.
Basic profiling#
The class TimeProfiler is a context manager that measures the amount of time spent running the code within a with block.
Here is an example:
from litebird_sim import TimeProfiler
from time import sleep

with TimeProfiler(name="my_code") as perf:
    sleep(1.0)

print(f"The elapsed time is {perf.elapsed_time_s():.0f} s")
The elapsed time is 1 s
Custom parameters#
The constructor for TimeProfiler accepts keyword arguments; they are saved in the parameters field of the object:
from litebird_sim import TimeProfiler
from time import sleep

with TimeProfiler(name="my_code", my_param="hello") as perf:
    sleep(0.1)

print("my_param =", perf.parameters["my_param"])
my_param = hello
Export to Speedscope#
You can collect several TimeProfiler objects in a list and save it in a JSON file that can be imported into Speedscope, an online viewer for performance profiles.
This can be done using the function profile_list_to_speedscope(), which outputs a dictionary that can be saved to a JSON file.
Here is an example:
import json
from litebird_sim import TimeProfiler, profile_list_to_speedscope
from time import sleep
perf_list: list[TimeProfiler] = []
# First code block to profile
with TimeProfiler(name="function_A") as perf:
sleep(1.0)
perf_list.append(perf)
# Second code block to profile
with TimeProfiler(name="function_B") as perf:
sleep(2.0)
perf_list.append(perf)
# Save the profile measurements into "profile.json"
with open("profile.json", "wt") as out_f:
json.dump(profile_list_to_speedscope(perf_list), out_f)
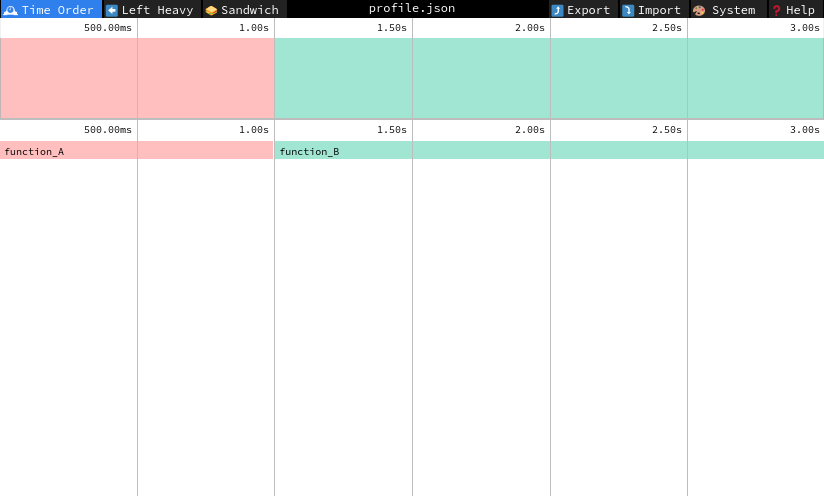
# Now go to https://www.speedscope.app/ and open "profile.json"
When the file profile.json is opened in https://www.speedscope.app/, you will see a time graph with two horizontal bars representing the two with blocks:
When using the Simulation class, a number of functions are automatically profiled and JSON files are saved automatically in the output directory.
See Sect. Profiling a simulation for more information.
API reference#
- class litebird_sim.profiler.TimeProfiler(name: str = '', **kwargs)#
Bases:
objectA context manager to profile the time spent by the code
This class implements a context manager that uses the performance counter provided by the system to compute the time spent within a
withblock.- elapsed_time_s()#
- valid()#
- litebird_sim.profiler.profile_list_to_speedscope(profile_list: list[TimeProfiler]) dict[Any, Any]#
Convert a list of
TimeProfilerobjects into a Speedscope fileThis function takes a list of
TimeProfilerobjects and creates a dictionary that conforms to the specifications of the Speedscope webapp. The dictionary should be saved to a JSON file and then opened within Speedscope.