Bandpasses
Some theory
Any electromagnetic detector is sensitive only to some frequencies of the spectrum, and it is vital to know what they are. We refer to these as the «bandpass», i.e., the list of frequencies that can «pass through the detector» and be detected. A bandpass is a function \(B(\nu)\) that associates the frequency \(\nu\) with a pure number in the range 0…1, representing the fraction of power that is actually measured by the instrument. The functional form of \(B(\nu)\) is usually called the bandshape, and it is usually nonzero in a limited subset of the real space.
A widely used analytical model of the bandshape is the top-hat bandpass:
Given a bandshape \(B(\nu)\), two quantities are usually employed to synthetically represent it:
The central frequency \(\left<\nu\right>\), which is just the average value of \(\nu\) when weighted with \(B(\nu)\):
\[\left<\nu\right> = \frac{\int_0^\infty \nu B(\nu)\,\mathrm{d}\nu}{\int_0^\infty B(\nu)\,\mathrm{d}\nu}\]which is of course the formula of the weighted average. For the top-hat band, the central frequency is \(\nu_0\).
The bandwidth \(\Delta\nu\), which is the width of the band, i.e., a measurement of how wide is the subrange of the electromagnetic spectrum sampled by the detector:
\[\Delta\nu^2 = \frac{\left(\int_0^\infty B(\nu)\,\mathrm{d}\nu\right)^2}{\int_0^\infty B^2(\nu)\,\mathrm{d}\nu},\]which is again inspired by the formula of the standard square deviation. For the top-hat bandshape, the value of \(\Delta\nu\) in (1) is exactly the bandwidth.
Modeling bandshapes
In the LiteBIRD Simulation Framework, bandpasses are encoded in the
class BandPassInfo, which can be used either to load
bandpasses from the IMO or to generate them on scratch. In the latter
case, you must specify the central frequency and the bandwidth,
alongside with other parameter that introduce a random component meant
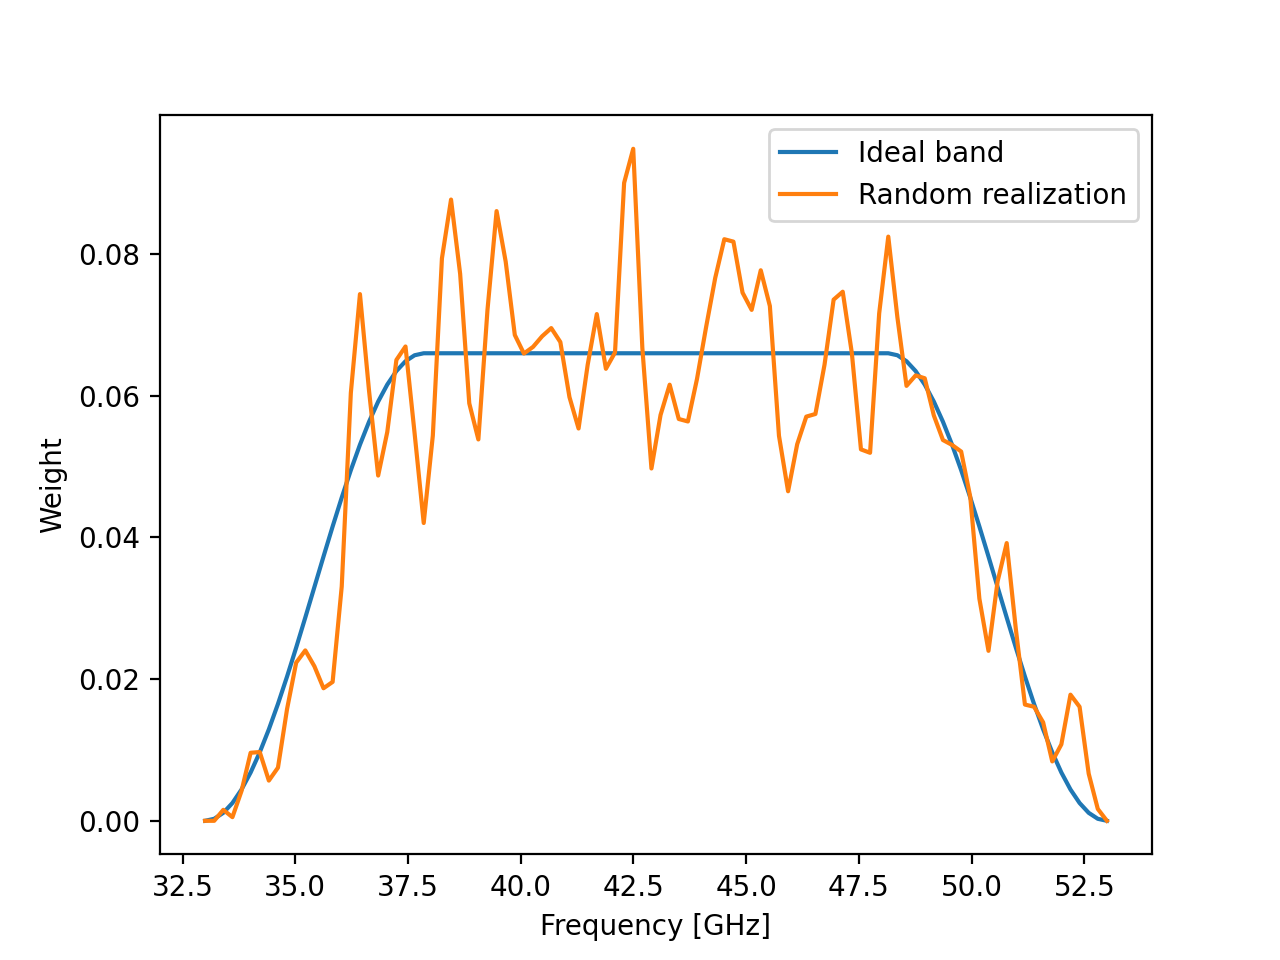
to make the band more realistic. Here is a simple example, which shows
how to create a bandpass and then how to add «noise» to make it more
realistic:
import litebird_sim as lbs
import matplotlib.pylab as plt

# Generate the «model» (i.e., ideal band, with no wiggles)
band = lbs.BandPassInfo(
    bandcenter_ghz=43.0,
    bandwidth_ghz=10.0,
    bandtype="top-hat-cosine",
    normalize=True,
    nsamples_inband=100,
)
plt.plot(band.freqs_ghz, band.weights, label="Ideal band")

# Now generate a more realistic band with random wiggles
new_weights = band.bandpass_resampling()
plt.plot(
    band.freqs_ghz,
    new_weights,
    label="Random realization",
)

plt.xlabel("Frequency [GHz]")
plt.ylabel("Weight")
plt.legend()
(Source code, png, hires.png, pdf)
API reference
- class litebird_sim.bandpasses.BandPassInfo(bandcenter_ghz: float = 0.0, bandwidth_ghz: float = 0.0, bandlow_ghz: float | None = None, bandhigh_ghz: float | None = None, nsamples_inband: int = 128, name: str = '', bandtype: str = 'top-hat', normalize: bool = False, model: str | None = None, alpha_exp: float = 1, beta_exp: float = 1, cosine_apo_length: float = 5, cheby_poly_order: int = 3, cheby_ripple_dB: int = 3)
Bases:
objectA class wrapping the basic information about a detector bandpass.
This class encodes the basic properties of a frequency band.
It can be initialized in three ways:
The default constructor will generate top-hat bandpasses, assuming that band centroid and width are provided.
Through the class method
from_imo(), which reads the detector bandpass from the LiteBIRD Instrument Model (see theImoclass).
- Parameters:
bandcenter_ghz (-) – center frequency in GHz
bandwidth_ghz (-) – width of the band (default=0.)
bandlow_ghz (-) – lowest frequency to sample the band, i.e. the first element of the frequency array considered (default: bandcenter_ghz - bandwidth_ghz)
bandhigh_ghz (-) – highest frequency to sample the band, i.e. the last element of frequency array considered (default: bandcenter_ghz + bandwidth_ghz)
nsamples_inband (-) – number of elements to sample the band (default=128)
name (-) – ID of the band
normalize (-) – If set to true bandpass weights will be normalized to 1
bandtype (-) –
a string describing the band profile. It can be one of the following:
top-hat(default)top-hat-exp: the edges of the band are apodized with an exponential profiletop-hat-cosine: the edges of the band are apodized with a cosine profilecheby: the bandpass encodes a Chebyshev profile
alpha_exp (-) – out-of-band exponential decay index for low freq edge.
beta_exp (-) – out-of-band exponential decay index for high freq edge
cosine_apo_length (-) – the numerical factor related to the cosine apodization length
cheby_poly_order (-) – chebyshev filter order.
cheby_ripple_dB (-) – maximum ripple amplitude in decibels.
- alpha_exp: float = 1
- bandcenter_ghz: float = 0.0
- bandhigh_ghz: float | None = None
- bandlow_ghz: float | None = None
- bandpass_resampling(bstrap_size=1000, nresample=54, model=None)
Resample a bandpass with bootstrap resampling.
Note that the user can provide any sampler built with the interpolate_band method; otherwise, an error will be raised!
This function should be used when the user wants to generate many realizations of bandpasses, e.g. per detector bands. There is no need to initialize many instances of the class
BandPassInfo, just rerun this functions multiple times issuing the same bandpass model instance.Args :
- bstrap_size (int): encodes the size of the random dataset
to be generated from the Sampler
- nresample (int): define how fine is the grid for the
resampled bandpass
- model (BandPassInfo.model): We can resample from a model previously
constructed with this function. The default value is set to
None: in this case, it initializes the bandpass sampler with the model set in the class instance (recommended use).
- bandtype: str = 'top-hat'
- bandwidth_ghz: float = 0.0
- beta_exp: float = 1
- cheby_poly_order: int = 3
- cheby_ripple_dB: int = 3
- cosine_apo_length: float = 5
- find_central_frequency()
Find the effective central frequency of a bandpass profile as defined in https://arxiv.org/abs/1303.5070
- static from_imo(imo: Imo, url: UUID | str)
Create a BandPassInfo object from a definition in the IMO The url must either specify a UUID or a full URL to the object.
- get_edges()
get the edges of the tophat band
- get_normalization()
Estimate the integral over the frequency band
- model: str = None
- name: str = ''
- normalize: bool = False
- normalize_band()
Normalize the band transmission coefficients
- nsamples_inband: int = 128